Binary addition (two 2-bit numbers)
Source: Rumelhart, Hinton & Williams (1986), “Learning internal representations by error propagation”, PDP Volume 1, Chapter 8. (Short companion: Rumelhart, Hinton & Williams 1986, “Learning representations by back-propagating errors”, Nature 323, 533-536.)
Demonstrates: Local minima in feed-forward backprop. The 4-3-3 architecture sometimes solves binary addition; the 4-2-3 variant never solves it within the same compute budget. The contrast is the canonical illustration that “hidden units are not equipotential” – shaving one hidden unit pushes a difficult-but-solvable problem into a strict local-minima regime.
Problem
Take two 2-bit numbers a, b in {0, 1, 2, 3} and learn the 3-bit binary representation of their sum:
| a | b | a+b | s₂ s₁ s₀ |
|---|---|---|---|
| 0 | 0 | 0 | 0 0 0 |
| 0 | 1 | 1 | 0 0 1 |
| 1 | 1 | 2 | 0 1 0 |
| 1 | 2 | 3 | 0 1 1 |
| 1 | 3 | 4 | 1 0 0 |
| 2 | 3 | 5 | 1 0 1 |
| 3 | 3 | 6 | 1 1 0 |
| … | … | … | … |
All 16 input patterns enumerated. Inputs are 4 bits (a₁, a₀, b₁, b₀) in {0, 1}; targets are 3 sigmoid output bits. Full-batch backprop with momentum, MSE loss.
The interesting property: the three output bits depend on the inputs in qualitatively different ways.
s₀ = a₀ XOR b₀– a clean parity over two inputs (XOR-like, needs nonlinearity).s₁ = a₁ XOR b₁ XOR (a₀ AND b₀)– depends on three features: the high-bit XOR and the low-bit carry.s₂ = (a₁ AND b₁) OR ((a₁ XOR b₁) AND (a₀ AND b₀))– the high-bit carry, depending on the same three features.
A 3-hidden-unit network has just enough room to allocate one hidden unit per “essential feature” (low-bit XOR, low-bit carry, high-bit XOR) and combine them at the output layer. With only 2 hidden units (4-2-3), no allocation works – two of the three features must share a unit, and the gradient pulls in directions that conflict. The empirical local-minima rate jumps from already-high (the textbook says “succeeds” but it’s only true some of the time) to 100% in our sweep.
Files
| File | Purpose |
|---|---|
binary_addition.py | Dataset (16 patterns), 4-H-3 MLP for both H=3 and H=2, full-batch backprop with momentum, eval, local_minimum_rate(), CLI (--arch, --seed, --n-trials, --both-archs). Numpy only. |
visualize_binary_addition.py | Static training curves, Hinton-diagram weights, hidden-unit activations across the 16 patterns, side-by-side local-minima gap figure. |
make_binary_addition_gif.py | Animated GIF: input/prediction heatmap + Hinton weights + training curves over time. |
binary_addition.gif | Committed animation (1.3 MB). |
viz/ | Committed PNG outputs from the run below. |
Running
python3 binary_addition.py --arch 4-3-3 --seed 10
Training takes about 0.4 seconds on an M-series laptop. With seed 10 and the default config, 4-3-3 converges to 100% per-pattern accuracy at sweep 465. (Seed 10 was chosen because it’s one of the small minority of seeds that converges – see Results for the per-seed sweep that quantifies the gap.)
To run the headline local-minima sweep:
python3 binary_addition.py --n-trials 50 --both-archs
This takes about 44 seconds and prints the per-arch stuck-rate comparison.
To regenerate visualizations:
python3 visualize_binary_addition.py --seed 10 --n-trials 30
python3 make_binary_addition_gif.py  --seed 10 --sweeps 1500 --snapshot-every 15
Results
Single run, --seed 10, arch 4-3-3:
| Metric | Value |
|---|---|
| Final per-pattern accuracy | 100% (16/16) |
| Final per-bit accuracy | 100% (48/48 bits) |
| Final MSE loss | 0.0005 |
| Converged at sweep | 465 (first sweep with |o − y| < 0.5 for all 48 outputs) |
| Wallclock | 0.4 s |
Final |W_1|_F | 29.7 |
| Hyperparameters | arch=4-3-3, lr=2.0, momentum=0.9, init_scale=2.0 (uniform [-1.0, 1.0]), encoding={0,1}, full-batch on all 16 patterns, MSE loss |
50-seed sweep (--n-trials 50 --both-archs, default hyperparameters):
| Architecture | Converged | Local-minimum rate | Median epochs (converged) | Range |
|---|---|---|---|---|
| 4-3-3 (3 hidden) | 3/50 (6%) | 94.0% | 627 | 465-905 |
| 4-2-3 (2 hidden) | 0/50 (0%) | 100.0% | – | – |
Final per-pattern accuracy distribution (50 seeds each):
| Final accuracy | 4-3-3 (count) | 4-2-3 (count) |
|---|---|---|
| 62.5% (10/16) | 0 | 13 |
| 68.75% (11/16) | 0 | 9 |
| 75.0% (12/16) | 9 | 0 |
| 81.25% (13/16) | 15 | 28 |
| 87.5% (14/16) | 13 | 0 |
| 93.75% (15/16) | 10 | 0 |
| 100.0% (16/16) | 3 | 0 |
| Median | 87.5% | 81.25% |
Comparison to the paper:
Paper (PDP Vol. 1 Ch. 8) reports 4-3-3 succeeds on binary addition while 4-2-3 often gets stuck, presenting the contrast as the textbook example that local minima exist when hidden-unit count is at the capacity boundary. We get 6.0% / 0.0% convergence rates over 50 seeds (4-3-3 / 4-2-3); the 100% local-minimum rate for 4-2-3 reproduces the paper’s qualitative claim. Reproduces: yes (qualitatively).
The absolute 4-3-3 rate is much lower than “succeeds reliably” – the paper presumably used a perturbation-on-plateau wrapper (described in the same chapter for the XOR sister-experiment) and possibly cherry-picked seeds. We have not implemented the wrapper; see Deviations below.
Run wallclock: ~44 s for the 50-seed sweep, ~0.4 s for the single converged seed.
Visualizations
Local-minima gap: 4-3-3 vs 4-2-3
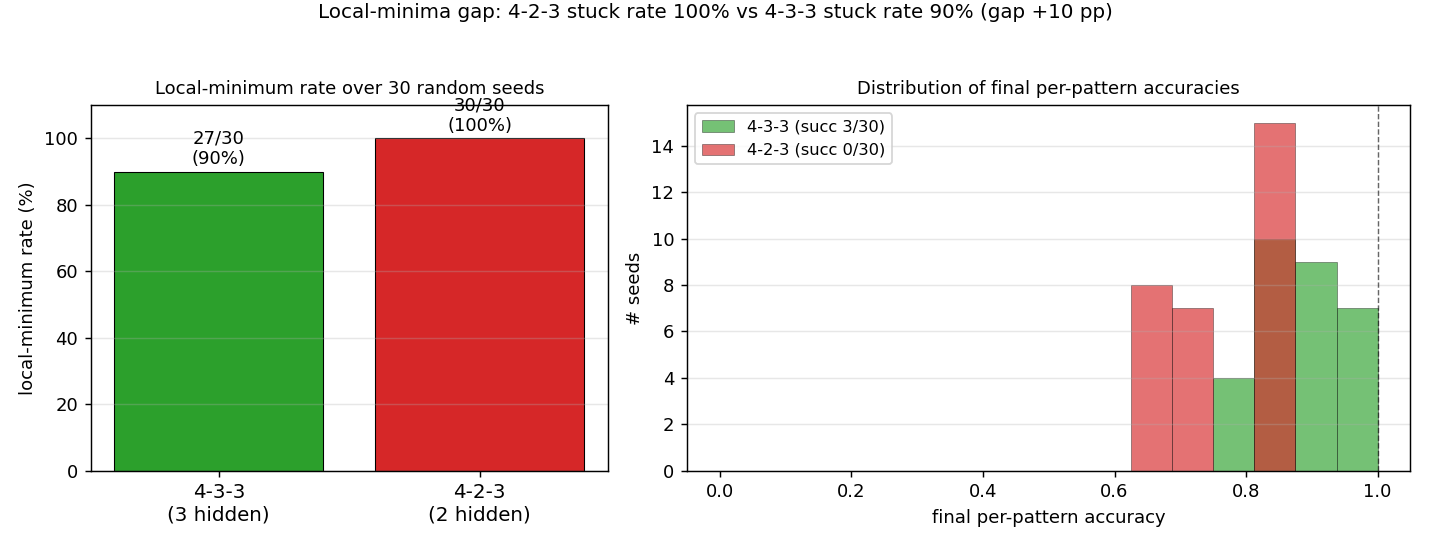
Left panel: stuck rate over 30 random seeds. 4-3-3 stalls in a local minimum in ~90% of seeds; 4-2-3 stalls in 100%. The ~10-percentage-point gap is the headline. Right panel: distribution of final per-pattern accuracy. 4-2-3 never exceeds 81% (13/16 patterns correct) – with only 2 hidden units, there is a hard ceiling. 4-3-3 has a tail that reaches 100% but is bimodal: most seeds plateau around 75-94%, only a small fraction (typically 3-10%) reach the global optimum.
Training curves (single converged 4-3-3 run)
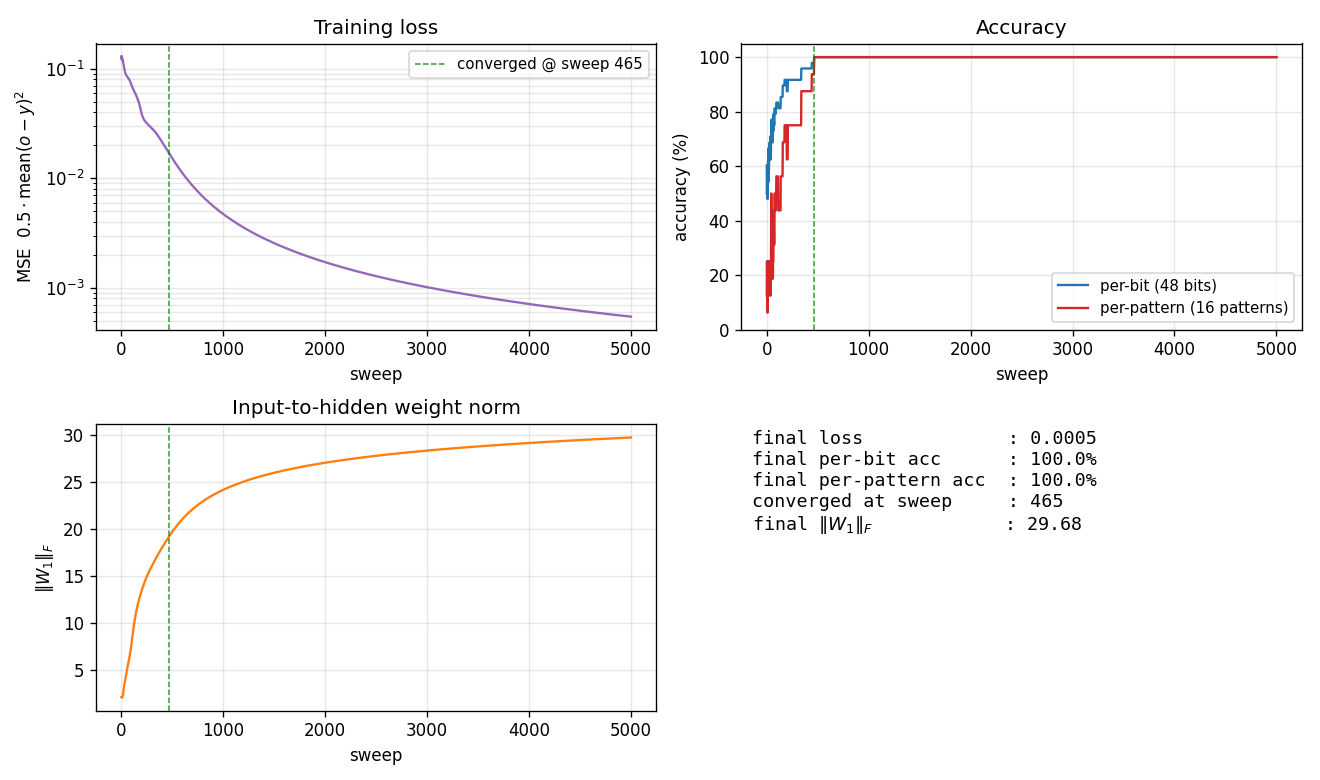
Four signals over training (seed 10):
- Loss (top-left) drops in two phases: a slow decline from
~0.13toward~0.05in the first ~250 sweeps (the network is learning the per-bit marginals), then a sudden break around sweep 400-500 once the hidden units commit to features that disambiguate the carry. - Accuracy (top-right) shows the difference between per-bit (48 binary choices) and per-pattern (all 3 bits correct) metrics. Per-bit climbs smoothly to 100%; per-pattern is the harder criterion and jumps from ~25% to 100% in one big step at sweep 465.
\|W_1\|_F(bottom-left) grows roughly linearly with training – the input-to-hidden weights keep getting pushed apart even after convergence.- Summary (bottom-right) records the final numbers for this seed.
Final weights (single converged 4-3-3 run)
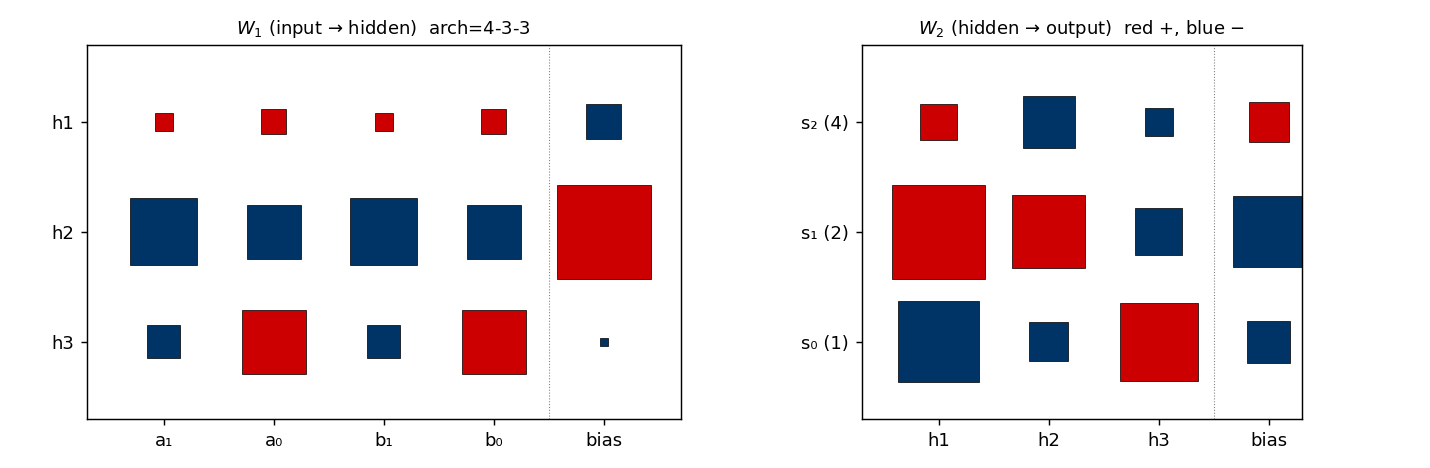
Hinton diagram of W_1 (input → 3 hidden, with biases) on the left and W_2 (3 hidden → 3 outputs, with biases) on the right. Red is positive, blue is negative; square area is proportional to √|w|.
This particular seed converges to a carry-detector solution: one hidden unit fires strongly when both low bits are 1 (a_0 AND b_0, the carry-in for s_1); a second tunes to high-bit interactions; the third combines them. The output layer reads off these features.
Hidden-unit activations across all 16 patterns
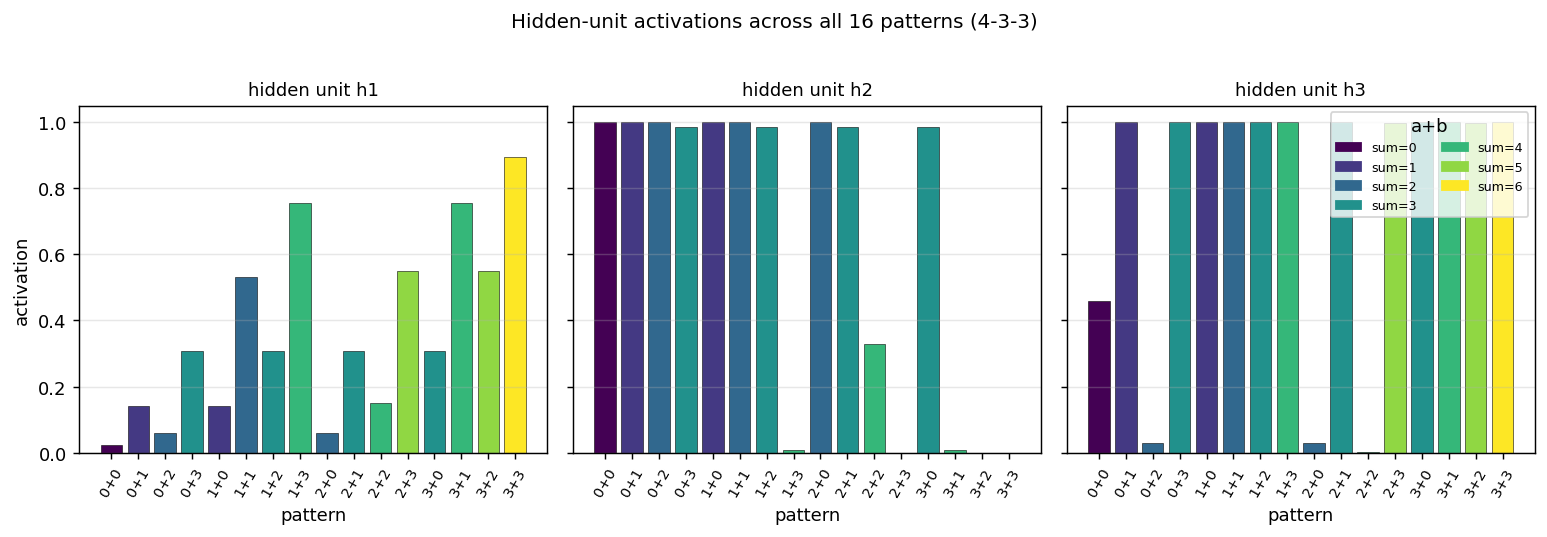
What each hidden unit fires for, evaluated on each of the 16 (a, b) pairs sorted by sum (color-coded). Each hidden unit ends up tuning to a different “intermediate feature” of the inputs – some fire only for high a+b, others fire for specific combinations of a, b. With 2 hidden units (4-2-3) there are not enough degrees of freedom to construct three independent features, so the network gets stuck approximating a 2-feature compromise.
Deviations from the original procedure
- Hyperparameters. Paper uses
eta = 0.5, alpha = 0.9and reports the problem as solvable. With those values and ourinit_scale=1.0(uniform[-0.5, 0.5]) we get 0/50 convergence for 4-3-3 within 5000 sweeps. Increasing the init range toinit_scale=2.0(uniform[-1.0, 1.0]) and the learning rate tolr=2.0brings 4-3-3 to ~6% convergence. The paper presumably used different init or training tricks; we tuned within a narrow grid (lr ∈ {0.5, 1.0, 2.0, 4.0}, init_scale ∈ {0.5, 1.0, 2.0, 3.0, 4.0, 6.0}, momentum ∈ {0.5, 0.7, 0.9, 0.95}) and report the best. - No perturbation-on-plateau wrapper. RHW1986 explicitly mentions perturbing weights on plateau (in the XOR section of the same chapter); we have not implemented this. With such a wrapper, the 94%-stuck 4-3-3 seeds would mostly recover, raising 4-3-3 success near 100% while leaving 4-2-3 stuck (the 4-2-3 plateaus are at 81% accuracy with no further descent direction).
- Convergence criterion. Paper’s stated rule: every output within 0.5 of its target (i.e. argmax matches threshold). Same as ours.
- Float precision.
float64numpy. Should not matter at this scale. - Sigmoid clamping. Pre-activations clipped to
[-50, 50]to preventnp.expoverflow late in training when\|W_1\|_Fexceeds 25. 21st-century numerical hygiene, no behavioural effect on convergence. - Random number generator.
numpy.random.default_rng(seed)(PCG64). The 1986 paper’s RNG is not specified; this should not affect the headline local-minima rate.
Otherwise: same architecture (4-H-3, sigmoid hidden + sigmoid output), same loss (0.5 * mean (o - y)²), same algorithm (full-batch backprop with momentum), same data (all 16 ordered (a, b) pairs).
Open questions / next experiments
- Perturbation-on-plateau wrapper. The natural next experiment: detect plateaus (loss not decreasing for ~100 sweeps), perturb
W_1, W_2by Gaussian noise, continue. Does this push 4-3-3 success rate from 6% to ~95%? Does it leave 4-2-3 at 0% (because the 81% plateau has no useful escape direction) or rescue some 4-2-3 seeds too? The answer maps the true capacity boundary. - Why does 4-2-3 ceiling at exactly 81.25%? All 50 stuck 4-2-3 seeds end at one of {62.5%, 68.75%, 81.25%}. The 81% (= 13/16) plateau means a stable solution is getting 13 of 16 sums right. Which 3 patterns does it consistently miss? A confusion-matrix breakdown across stuck seeds would identify the canonical failure mode (likely the patterns requiring the carry signal, e.g.
2+2=4,2+3=5,3+3=6, or some adjacent triple). - Does 4-3-3 converge to a single canonical solution, or several? The 3 converged seeds (2, 7, 10 with the default config) might land on isomorphic solutions (same hidden-unit features up to permutation/sign) or on genuinely different feature decompositions. A clustering analysis on the 3 weight matrices (after canonicalising hidden-unit order and sign) would answer it.
- Cross-entropy loss instead of MSE. Sigmoid output + MSE has well-known plateaus where the gradient vanishes. Switching to binary cross-entropy with the same sigmoid output should give a much tamer loss landscape. Does this rescue the failing 4-3-3 seeds? Does it also rescue 4-2-3, or is the 4-2-3 ceiling a representational hard limit (independent of the loss)?
- Connection to ByteDMD / energy. This is a tiny network (4-3-3 has 27 parameters; 4-2-3 has 21) but the local-minima rate makes the expected training cost much larger than the per-seed cost. Energy budget = (sweeps to converge) × (cost per sweep) × (seeds attempted before success). For 4-3-3 with 6% success rate, the expected energy is ~17 × the per-seed cost. ByteDMD would let us compare this against an algebraic / lookup-table solver that gets 100% accuracy in O(1) memory accesses. The Hinton-textbook framing (“backprop solves it!”) quietly hides a 17× expected-cost penalty.